Out-of-box Solutions
Product design, UX/UI
Role
Product Designer
Team
Product Team @ FogHorn
Duration
Feb 2020-Sep 2023

Overview
In FogHorn Systems’ parlance, a “Solution” was part of a product line aimed at the needs of myriad industrial environments. A given Solution could leverage real-time analytics, sensor feeds like cameras and thermometers, and other data feeds, to provide real-time insights about a system’s status, and the various dynamic elements therein.
Out-of-box (OOB) Solutions setup apps promised to free FogHorn users from having to create their own analytic expressions, machine learning models, or dashboards. Instead, a series of setup apps would automate much of these processes—making machine learning, analytics, and data visualization easy—within a series of standalone tools.
Once the user was satisfied with the OOB Solution’s training, they could configure alert triggers around various data thresholds, deploy the Solution to selected edge devices, and monitor their KPIs in FogHorn’s purpose built dashboard environment.
ℹ️ FogHorn Systems was a leading developer of industrial and commercial applications optimized for industrial edge environments with limited or no network connectivity. FogHorn was acquired by Johnson Controls in January 2022.
Mission statement
To provide the user with a series of seamless, visual setup apps to help them to create their analytic expressions, train their machine learning models, and view the outputs in dashboards.
Our proposed OOB setup app (left) in relation to the broader existing ecosystem

Typical flare-tagging experience prior to the introduction of our OOB setup app

Goals
To create a streamlined experience to help users reach their goals as quickly as possible.
- To break the process up into digestible steps to allow for focus and simple navigability
- To offer all the tools needed for users to tailor a Solution to the unique attributes of the target environment
- To make existing Solutions easy to modify over time
Who is our targeted user?
Technical users well-versed in such common tasks as imagery tagging and ML model training. These users were also familiar with the setup and layout of their target environments. These were advanced users who didn’t need to learn the basics from a technical perspective.
Challenge overview
If users didn’t train their models accurately, the outputs generated—such as alerts and dashboard visualizations—wouldn’t be helpful. We aimed to mitigate these risks through inline feedback and documentation.
Initial concepts
Though each of these OOB setup apps would have specific purposes and unique controls, there were certain underlying commonalities. From flare detection to PPC compliance, each of these setup apps involved working out not just how the underlying system worked, but tying that into physical spaces: the orientation of cameras, the movement of people through checkpoints, the temperature of equipment, and more.
Mapping out the inputs and outputs—sometimes abstractly, and sometimes more literally—was an essential step to figuring out how we would go about the actual design.


Elevated body temperature conceptual setup and camera setup
My process
In my role as the product designer, I led a collaborative effort alongside my product manager and engineering manager, designing this newly-realized system as outlined in a collection of comprehensive technical documents, guided and honed by customer needs, user interviews, and technical limitations. My responsibilities included iterating on data-informed concepts, culminating in the creation of mid- and high-fidelity mockups.
Throughout, we remained accountable to internal and external stakeholders, to ensure the project’s success. The OOB initiative was deemed of high value to the company, and of high impact to our customers, which would allow us to make a significant contribution to our organizational objectives.


Design began with a series of conceptual wireframes


As component designs solidified, I provided detailed specs for the engineering team


Meanwhile, documentation covered such external requirements as camera calibration
Solution overview
Our approach was twofold. By breaking each respective OOB process down into its components steps—from video upload, to tagging, to alert configuration—I was able to put together a design that allowed the user to focus on each individual task. Through continual conversations with users to gather feedback, we were able to hone the presentation of these concepts to the most minute elements.
The result would be an elegant wizard tool that balanced an engaging presentation with power and flexibility.
User research
Throughout the planning, design, and execution of the OOB initiative, my team remained engaged with internal and external stakeholders, to incorporate qualitative feedback into every stage of the design. Their guidance was invaluable, and key to ensuring that the workflow and the tools met their exacting expectations, based on the existing challenges they faced using a collection of older, more abstracted tools.
And understanding what users needed enabled me to spearhead the conceptualization and design of this new tool.
A new experience


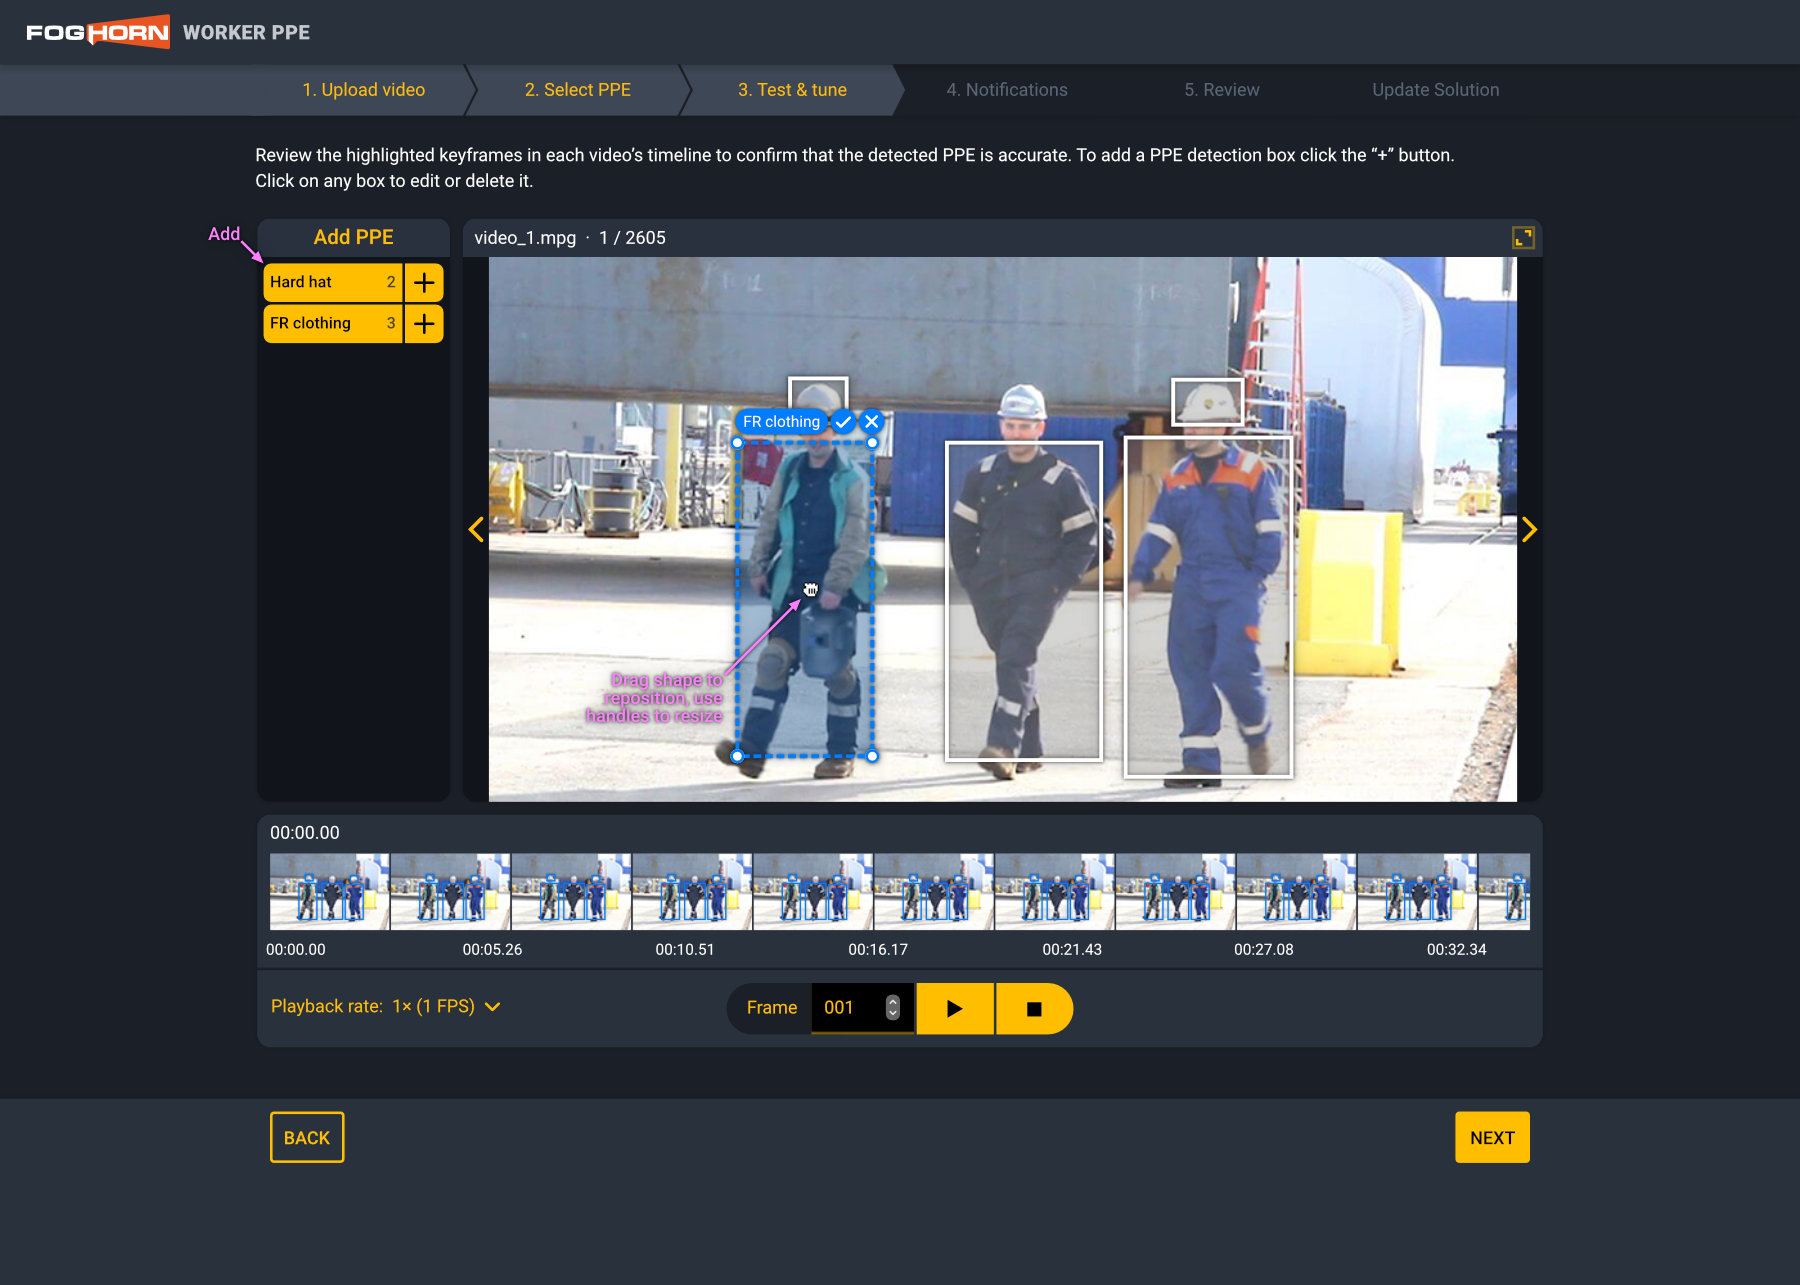
The tagging of reference video was key to model training
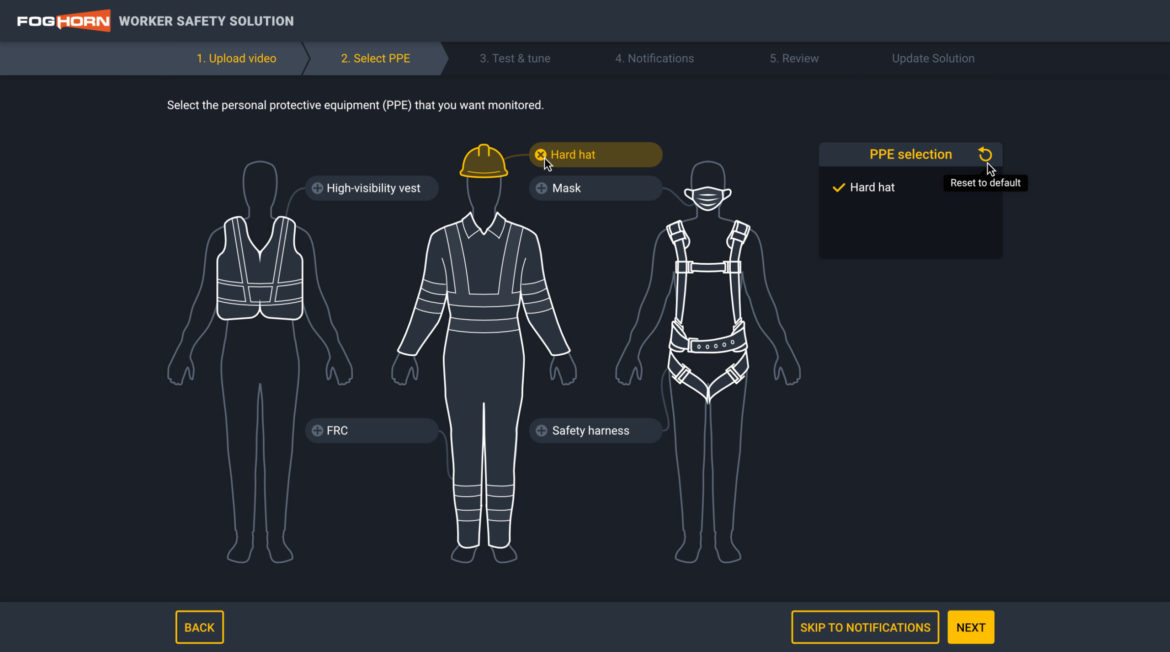
Though the tools for each setup app was tailored for a specific use case, the organization and layout of each tool was similar. To begin, the user would uploaded a reference video of their site to provide a baseline for the machine learning algorithms. They then specified what they were interested in tracking (e.g. PPE, hazards, chimney flare makeup, etc.), tagging the video clips to indicate each object type or area type within the footage.
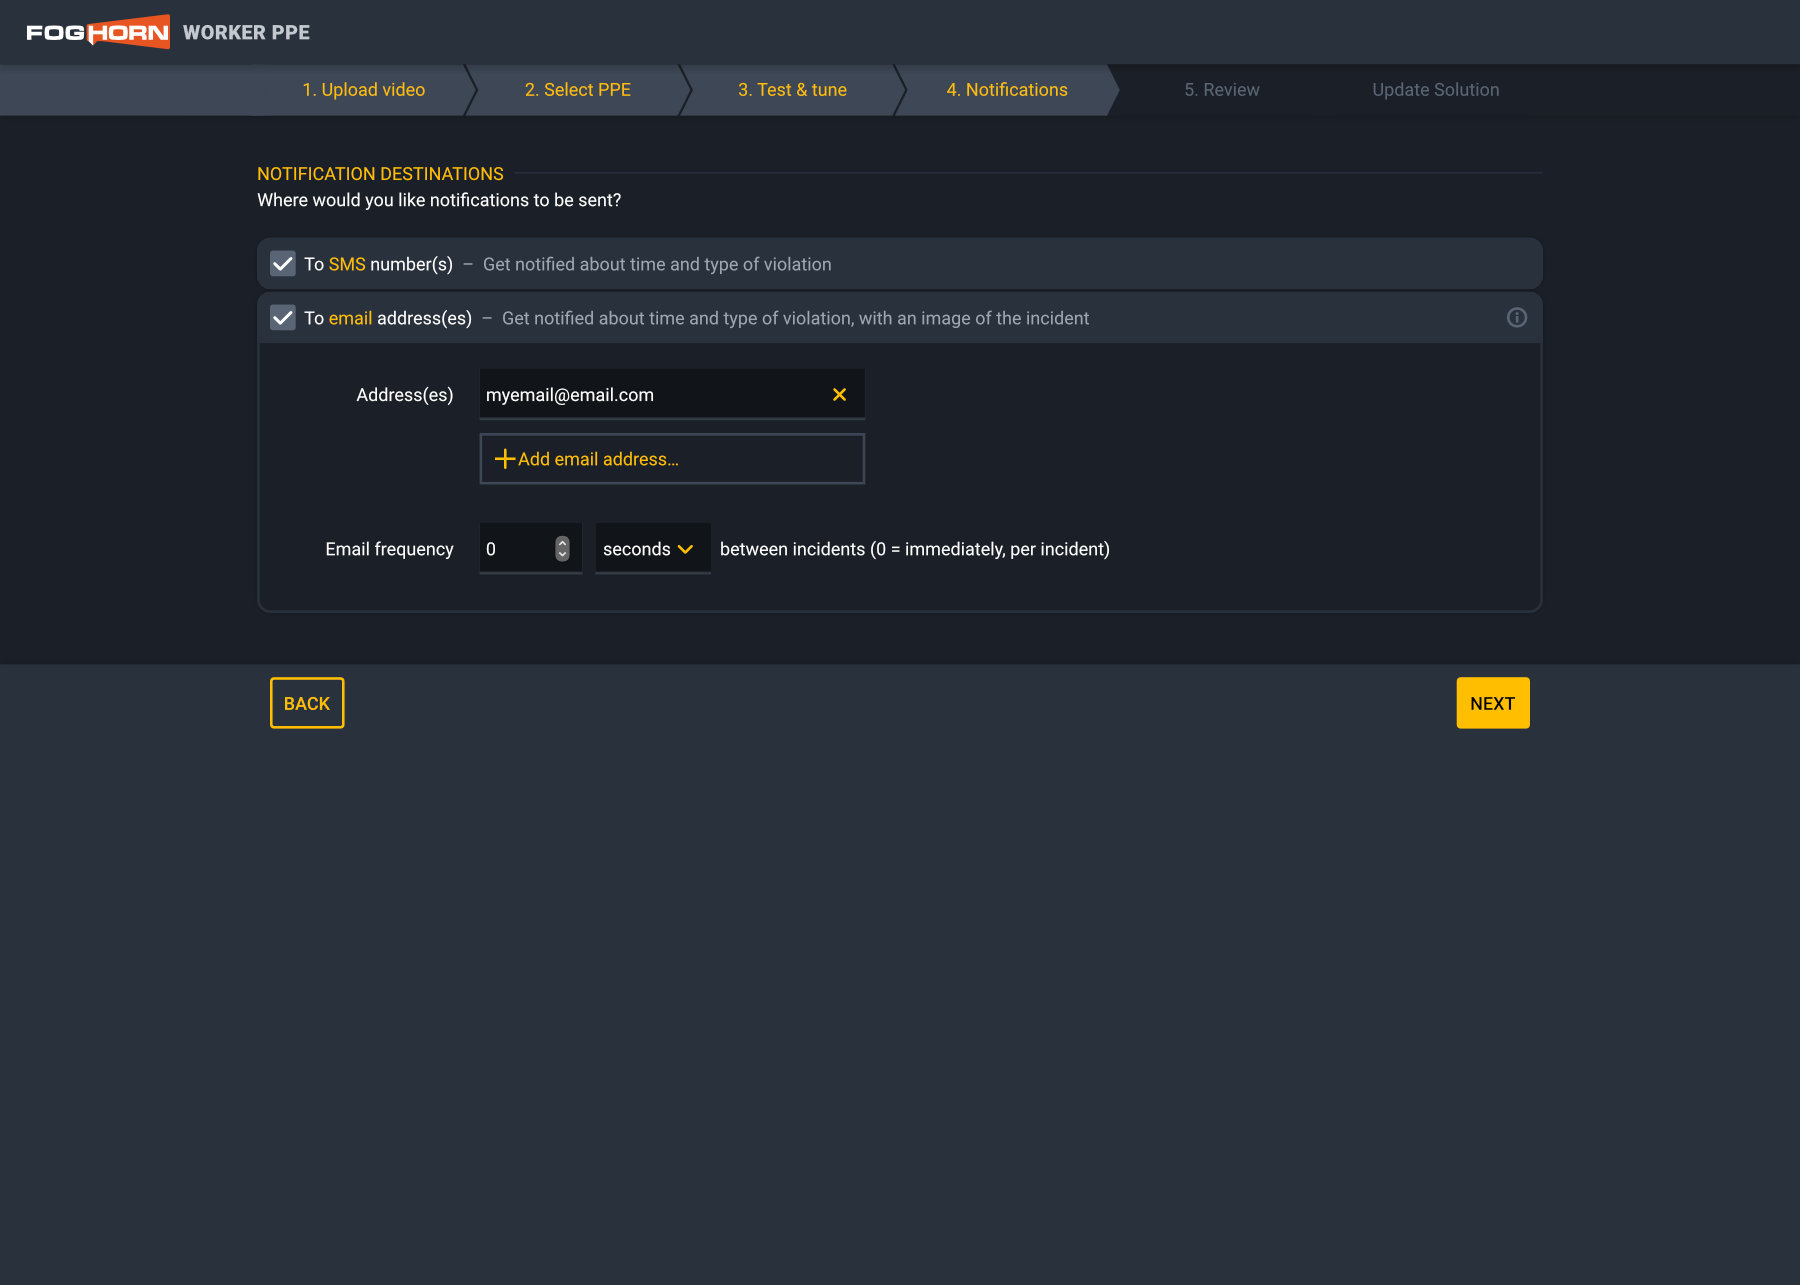
After the tagging work was complete, the user set up their notification preferences. Here I explored various means of allowing users to interactively set notification thresholds, destinations, and frequencies.


Threshold notification concept and destination settings
Finally, once the user had configured and trained their Solution, they could monitor their KPIs using dashboards that provided streaming feedback.


Dashboards showed real-time and historical feedback
Impact
Our users worked in high-security environments, so we didn’t get detailed quantified insights such as increased sales. However, their glowing feedback made up for that. The easy-to-navigate presentation improved their confidence in their deployments, as well as their trust that our team was highly responsive to their needs.
Our first OOB tools were rolled out to positive response, such that FogHorn devised a whole slate of additional such tools, from hazard detection to health monitoring to broader building management Solutions.
Lessons
Throughout this project—or projects, really, since each Solution setup apps were tailored to their specific use cases—I learned a lot from working side by side with our star users. Most of the iteration centered around small things like labels and the placement of individual affordances.
Of course my baseline goal with these designs was to provide the user with controls and features customized for each task, whether tagging a region on a reference frame, or scrubbing through a video clip. But, approaching the challenge from a product design, UX, and human behavior perspective, I tried to design the tool such that it was an active partner in each targeted task—consistent and thus familiar from one OOB to the next, but each one tuned to its specific purpose.