VIZ Visual Dashboard Builder
Product design, UX/UI
Role
Product Designer
Team
Product Team @ FogHorn
Duration
Jul 2017-Sep 2023
VIZ was a data-driven visual dashboard construction tool for Industrial Internet of Things (IIoT) environments. VIZ dashboards allowed operations technology (OT) teams to visualize real-time data streams, and monitor the efficiency and health of their environments without the need to code.
Starting with an open canvas, users built their dashboards using a series of dynamic cards to visualize the results of analytic expressions, display output of machine learning (ML) algorithms, validate sensors, or troubleshoot diagnostics of input sources.
ℹ️ FogHorn Systems was a leading developer of industrial and commercial applications optimized for industrial edge environments with limited or no network connectivity. FogHorn was acquired by Johnson Controls in January 2022.
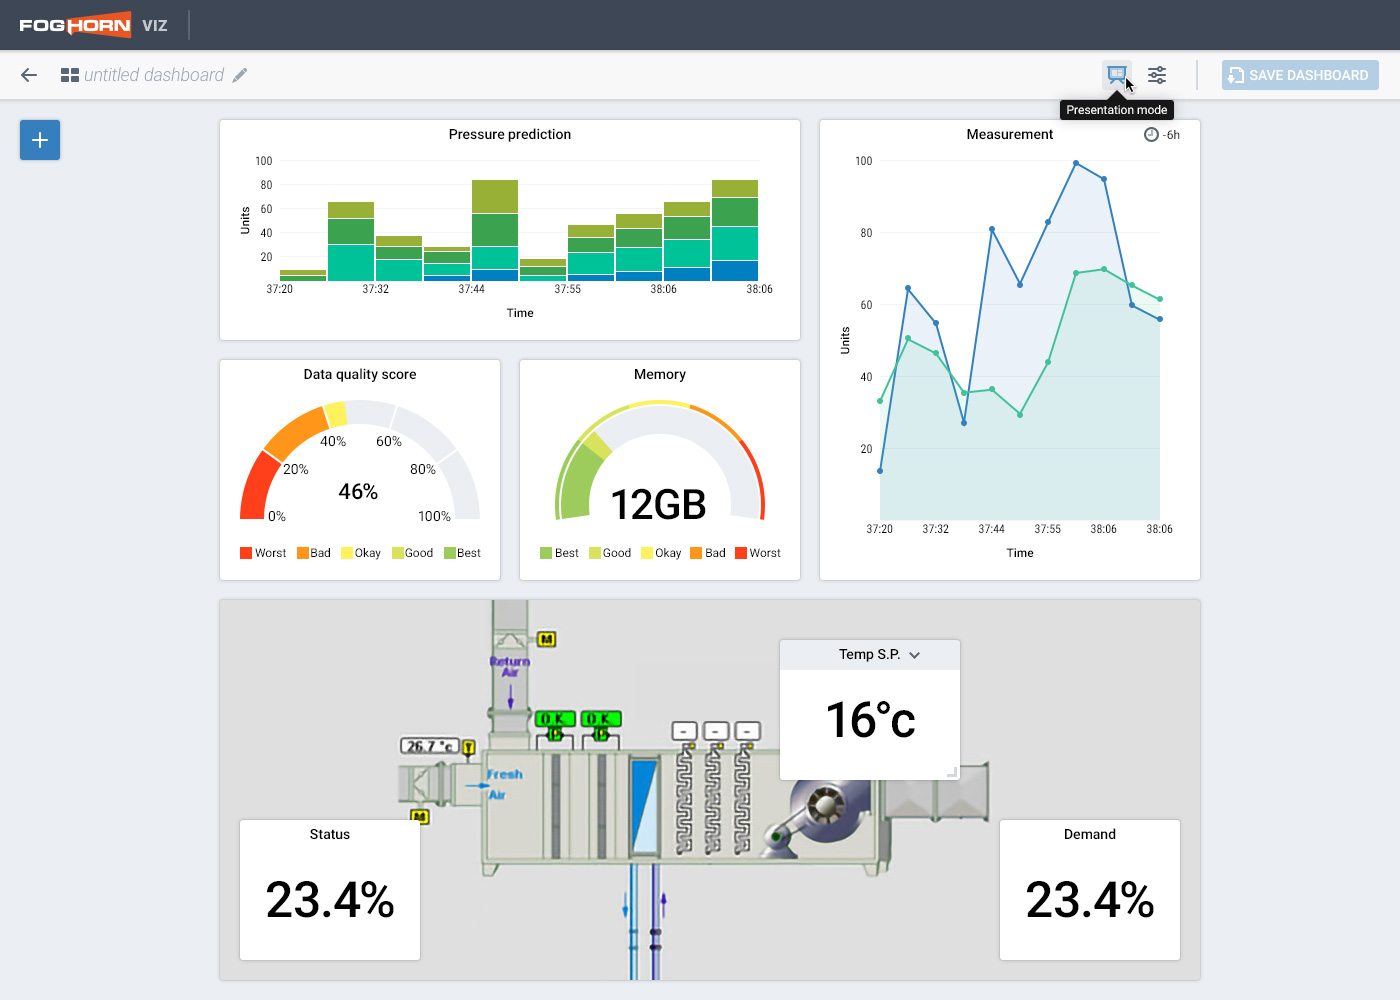
VIZ dashboard, example layout
Each card could be sized and positioned visually, to best accommodate the users' respective data visualizations, such as line graphs, bar charts, gauges, maps, video feeds, and more.
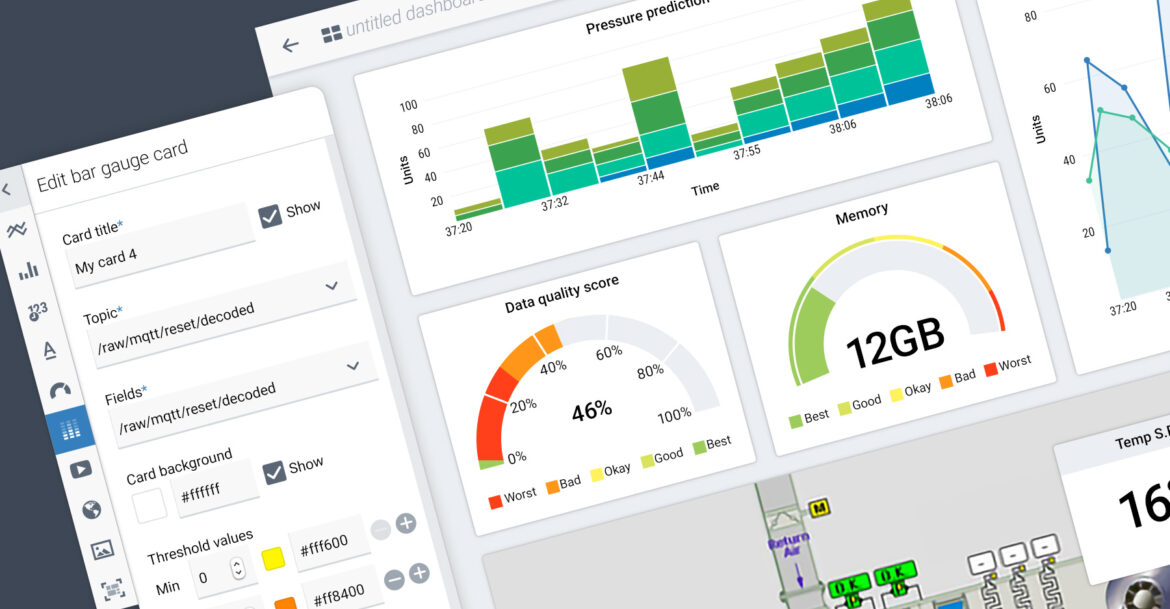
Early dashboard spec annotations
Working with my team—from project managers to engineers—I iterated on the designs of every element, using our design system where applicable, and augmenting as necessary as we invented new elements and components.
The design required guidance on everything from layout and dynamics, to card controls and states, to color palettes and content rules. Annotations spelled out certain individual specifications, and helped engineers to maintain consistency as they implemented bespoke components.
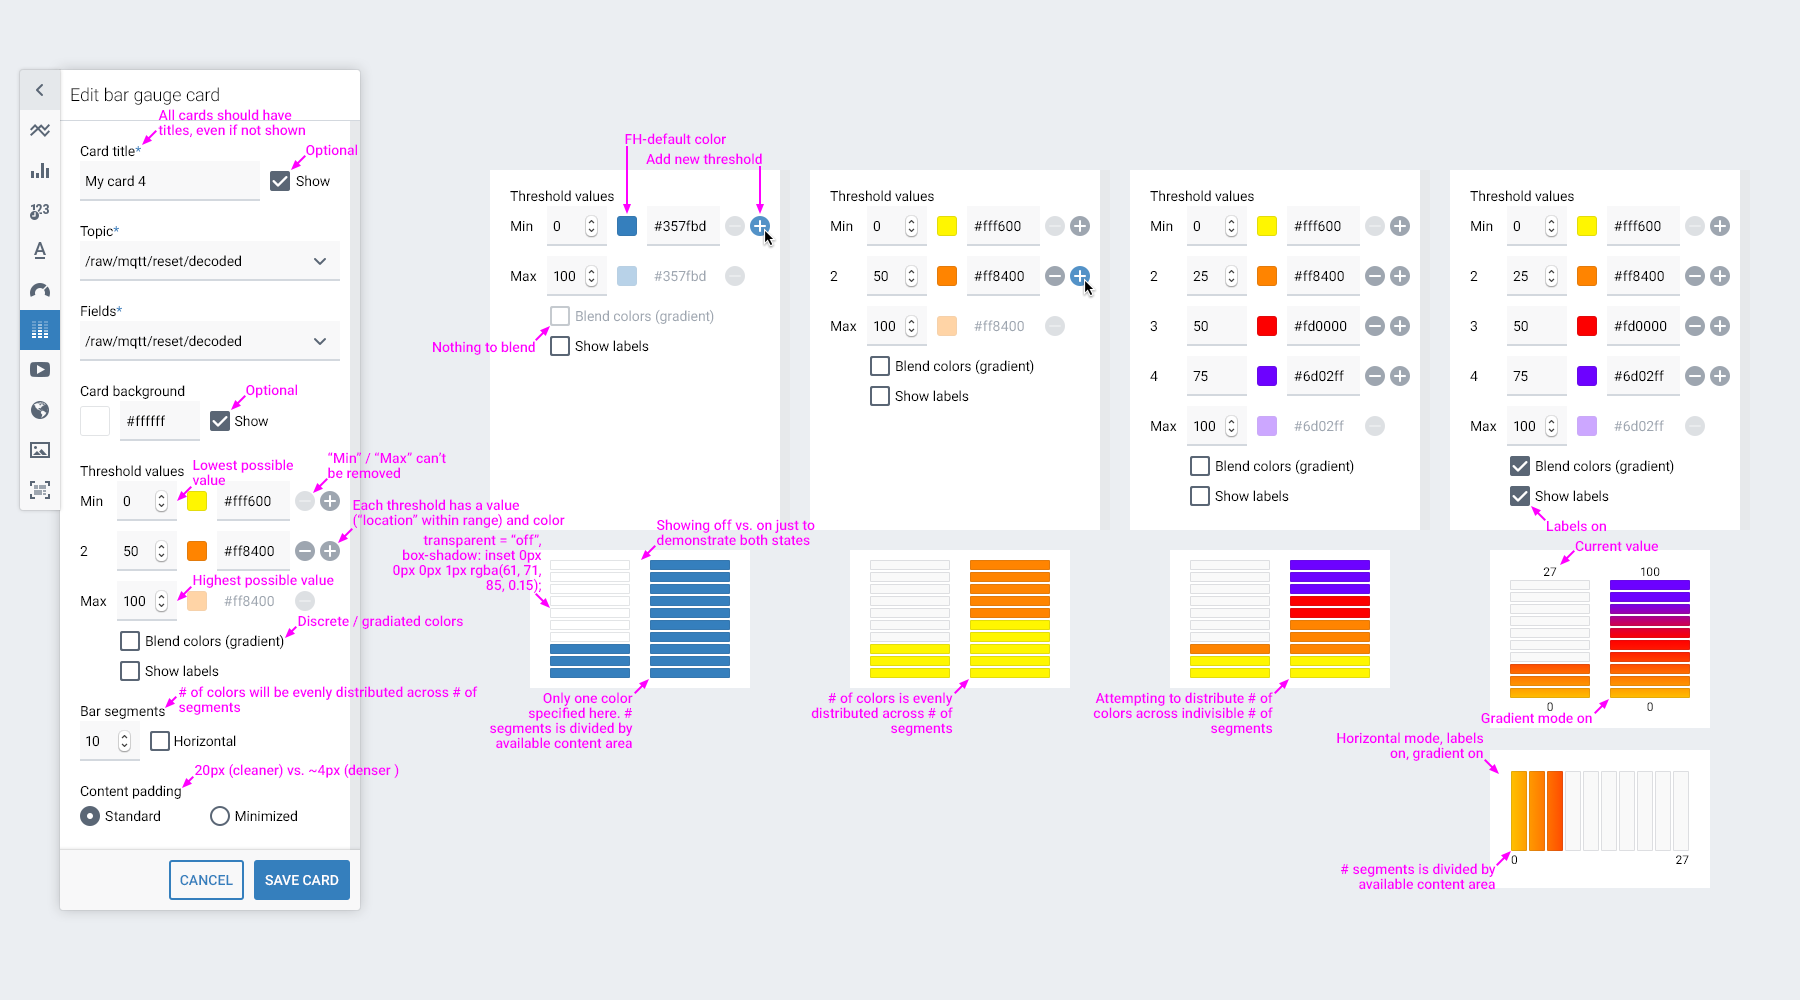
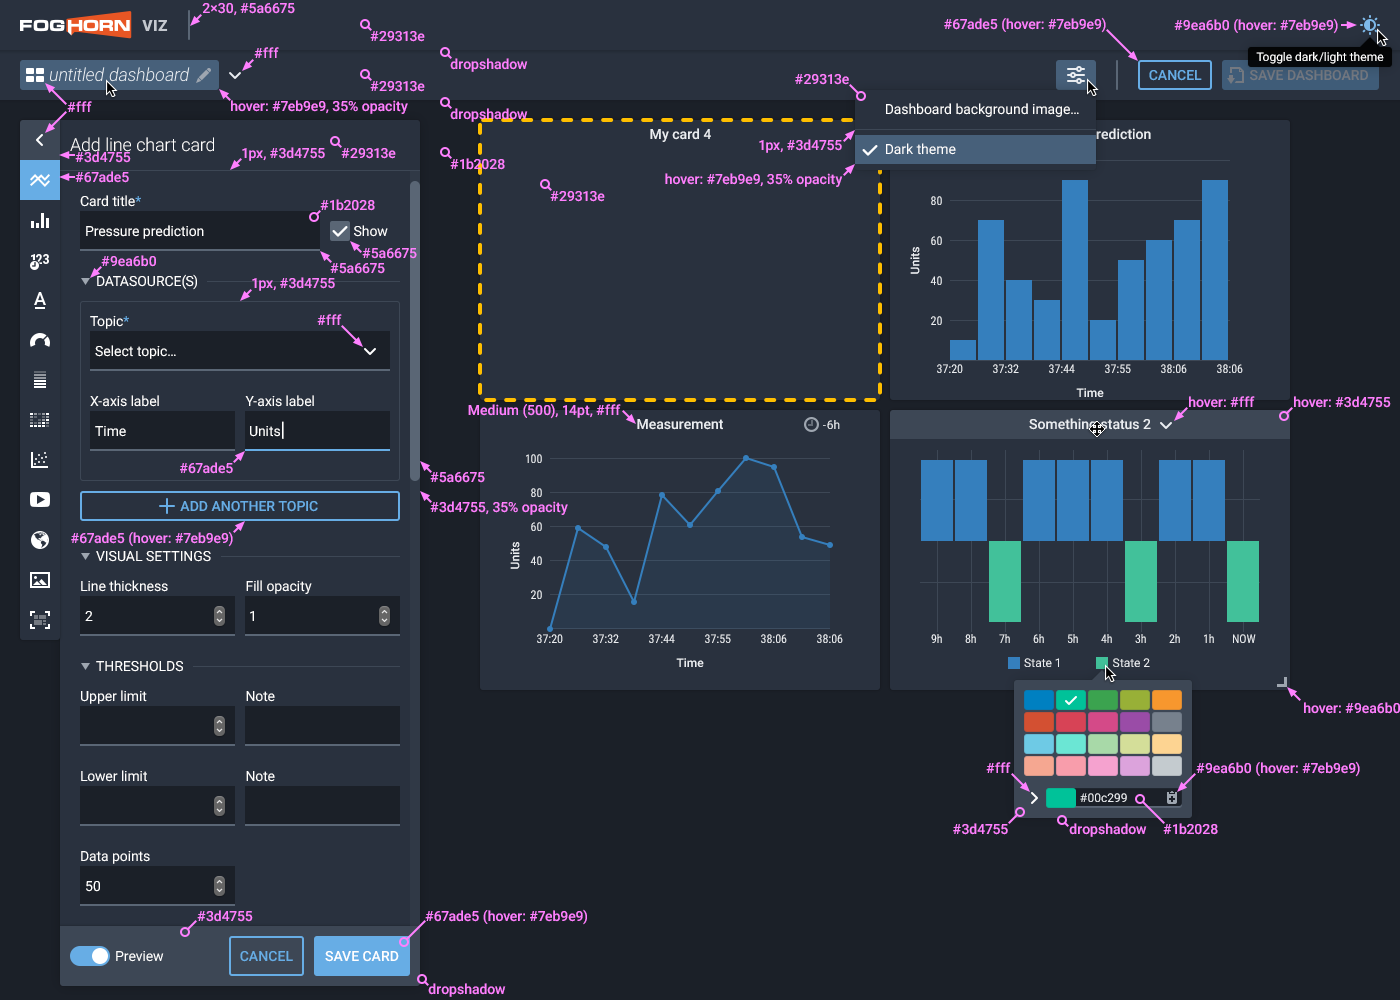
Dynamic settings flow
Cards were versatile, and offered users dynamic settings to accommodate their needs, as well as the specifications of data models. Where the needs and limitations were ambiguous, this iterative exercise proved valuable for honing our offering to better balance user needs vs. technical capabilities.
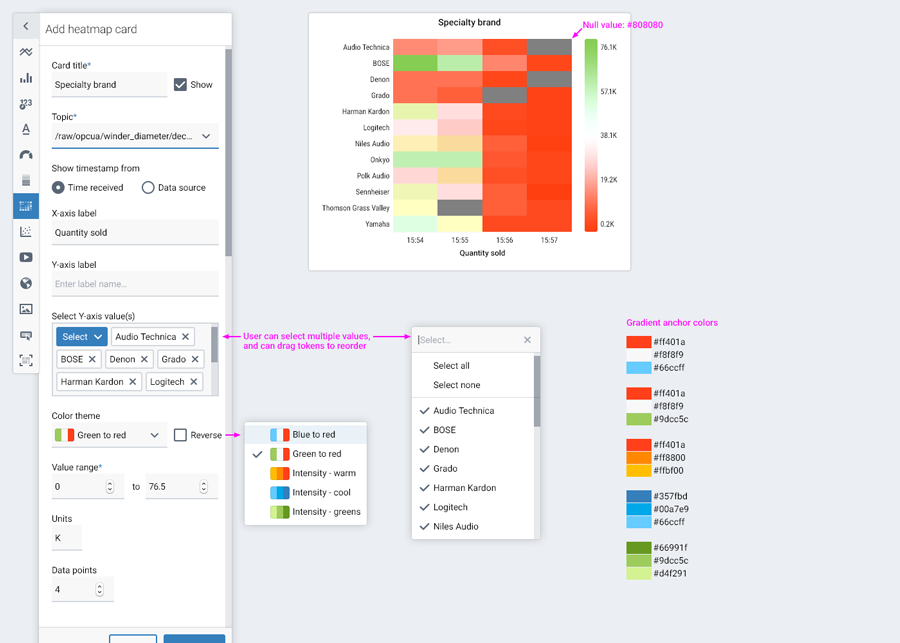
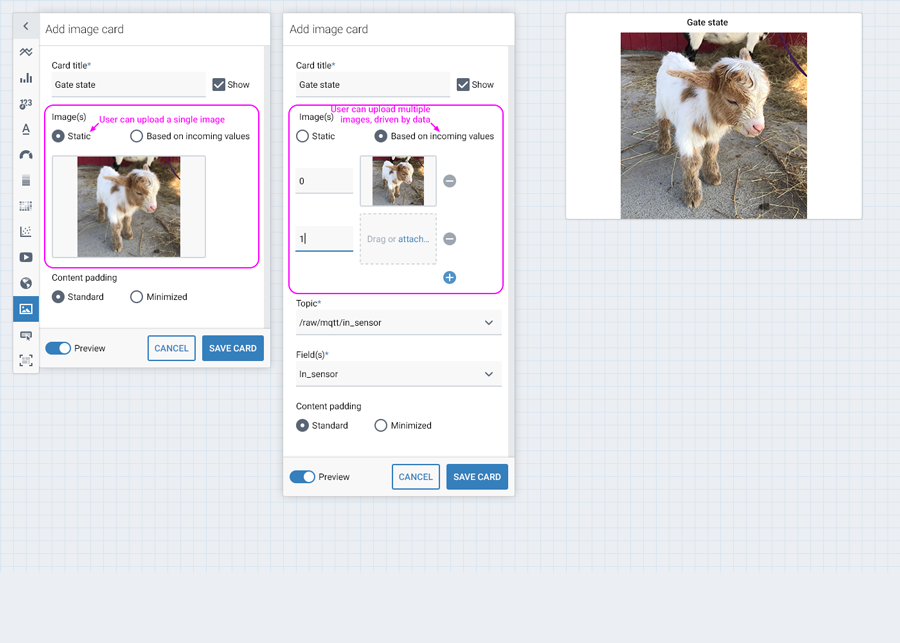
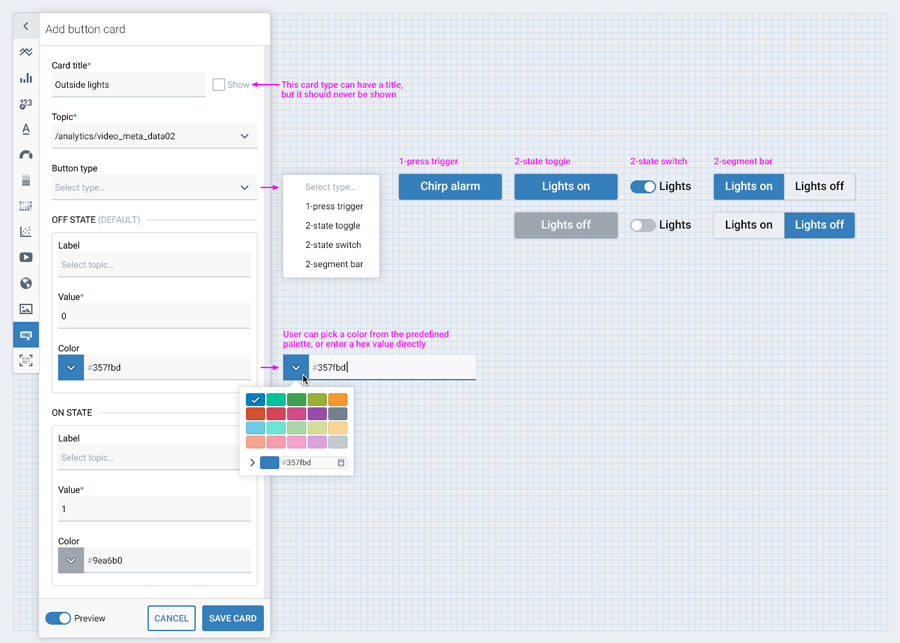
Dynamic settings flows
I designed flows to illustrate the user's progression through myriad options for each unique card type.
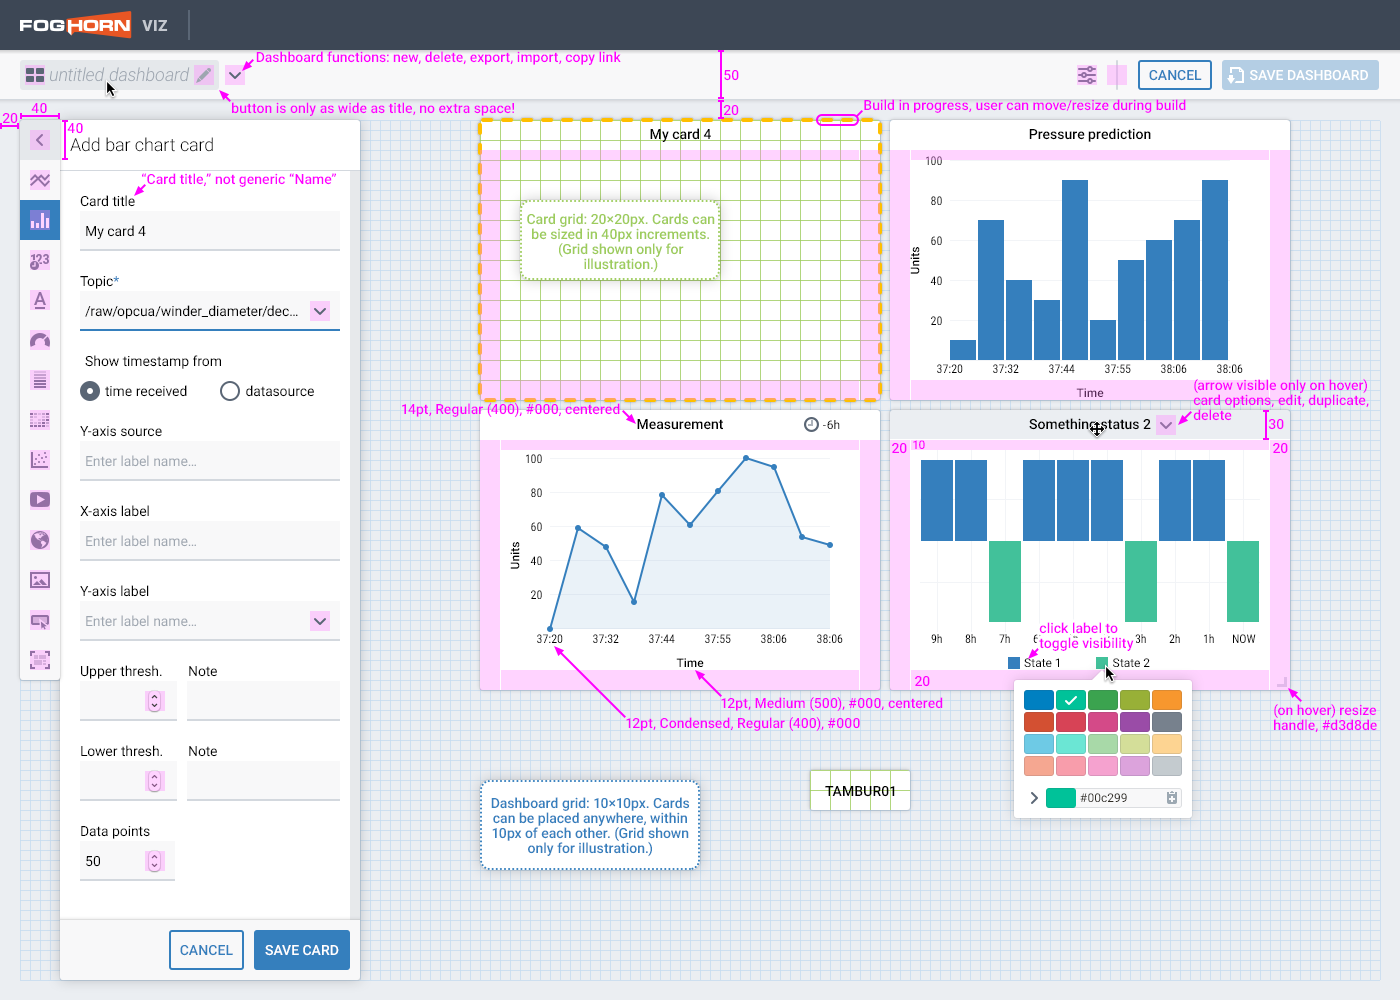
Similarly, I used grids and guidelines to illustrate to the engineering team how cards could be sized and positioned on the canvas, and how these properties might affect the content of each card type.
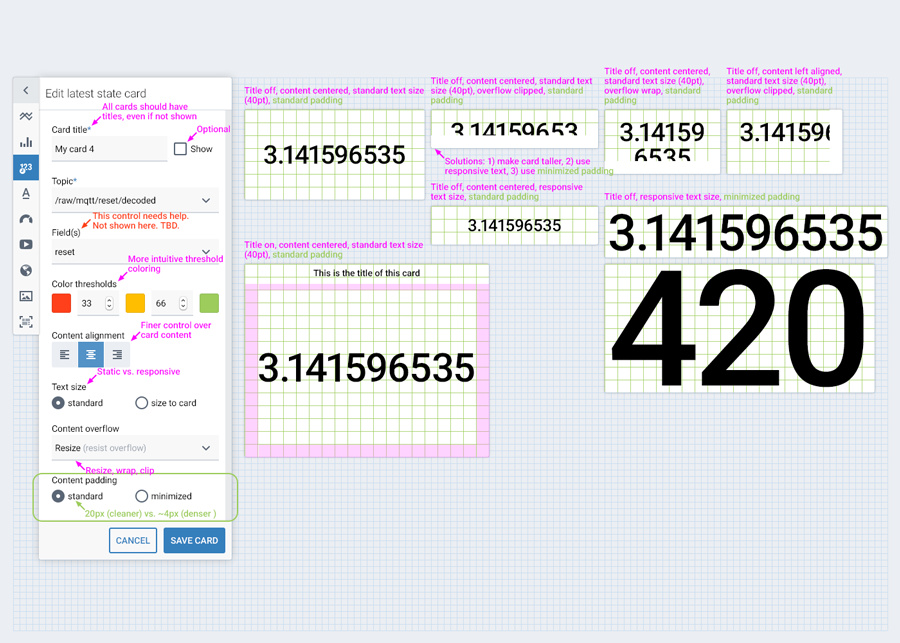
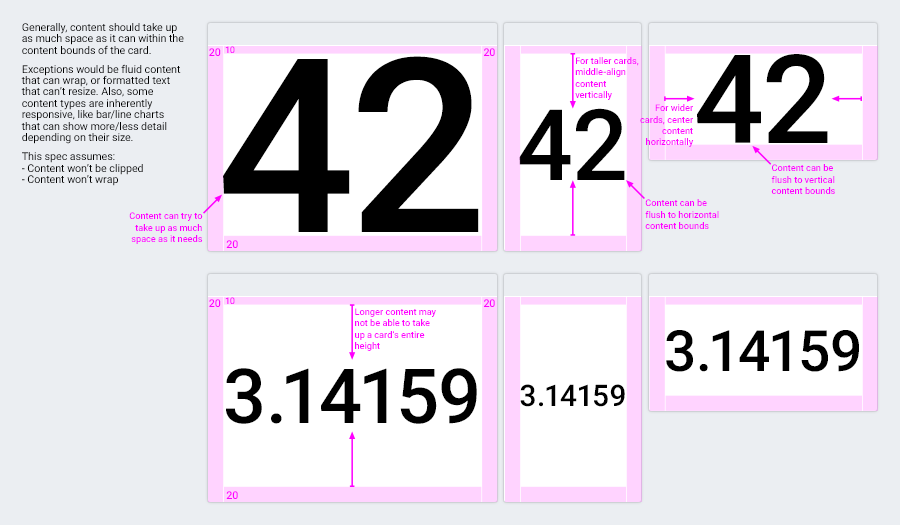
Content and layout spec exploration